a coder's diaries

0%

G6从初探到实战流程图绘制

前言

最近我开发的模块需要在线绘制流程图,和G6Editor类似,但是G6Editor不开源,只能用它的底层库G6实现了。先做了一版Demo练习API,如下图
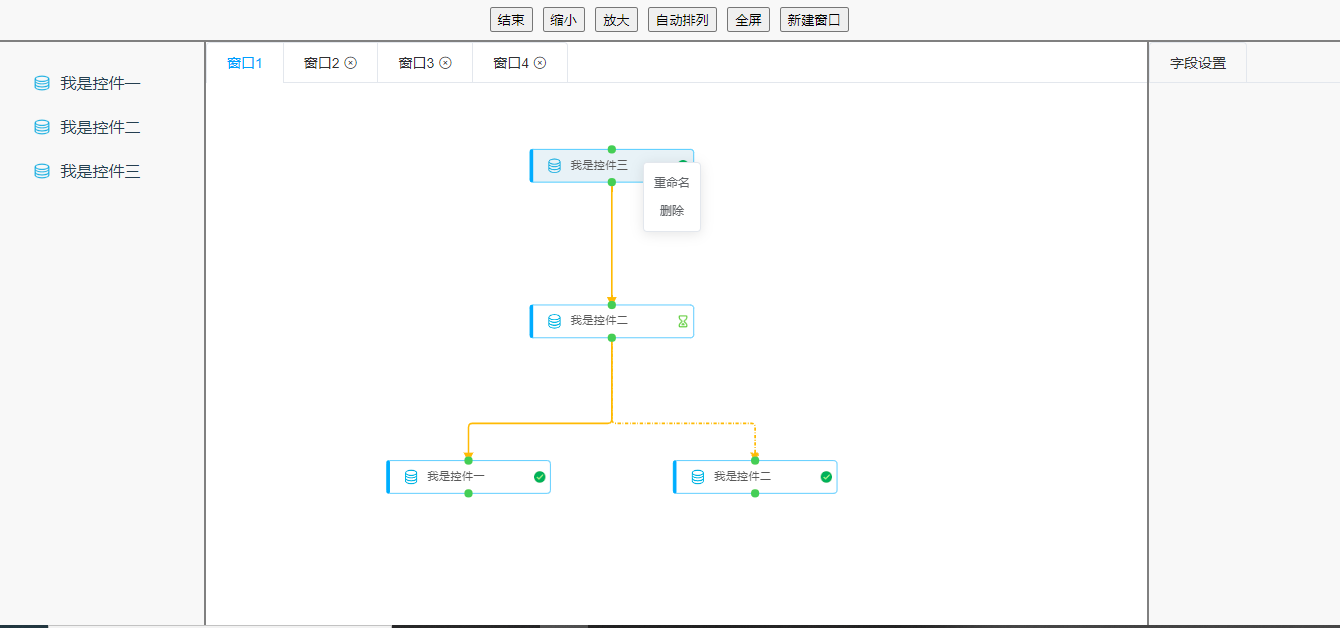
g6_demo

初版

  • 拖拽生成节点
  • 锚点连线,连线动画效果
  • 右击修改名称、删除,选中后键盘删除
  • 画布缩放、自适应、全屏
  • 修改每个节点参数,新建窗口

进阶版

  • 自定义节点
  • 自定义边
  • 自定义behavior
  • 自定义动画

实现过程

1. 绘制画布

首先需要一个带id的标签当作画布的容器

1
<div id="mountNode"></div>

然后创建画布,配置默认参数

1
2
3
4
5
6
7
8
9
10
11
const graph = new G6.Graph({
container: 'mountNode', // String | HTMLElement,必须,容器 id 或容器本身
width: 800, // Number,必须,图的宽度
height: 500, // Number,必须,图的高度
defaultNode: {}, // 节点的默认类型和样式,包括锚点的显示和位置
defaultEdge: {}, // 边的默认类型和样式
nodeStateStyles: {} // 节点状态变化时的样式,例如选中、hover
edgeStateStyles: {} // 边状态变化时的样式
modes: {} // 配置behavior, 例如内置的画布拖拽、节点拖拽,自定义的行为
...
});

最后渲染数据

1
2
3
4
5
6
7
const data = {
// 点集
nodes: [],
// 边集
edges: [],
};
graph.read(data);

2. 拖拽生成节点

Html标签内置的draggable为true便可拖拽。将左侧控件拖动到画布上时,生成一个新的节点

1
2
3
4
5
6
7
8
9
10
11
12
13
14
15
16
handleDragstart(e) {
this.offsetX = e.offsetX;
this.offsetY = e.offsetY;
},
handleDragEnd(e, item) {
let data = {};
Object.assign(data, item);
data.offsetX = this.offsetX;
data.offsetY = this.offsetY;
const graph = this.graph;
const xy = graph.getPointByClient(e.x, e.y);
data.x = xy.x;
data.y = xy.y;
data.id = uniqueId();
graph.addItem("node", data); // 使用addItem或者add添加节点或边
}

3. 生成边

想要鼠标边拖动边画边的效果,需要自定义添加边的交互,放到modes里

1
2
3
4
5
6
7
8
9
10
11
12
13
14
15
16
17
18
19
20
21
22
23
24
25
26
27
28
29
30
31
32
33
34
35
36
37
38
39
40
41
42
43
44
45
46
47
48
49
50
51
52
53
54
55
56
57
58
59
G6.registerBehavior("add-edge", {
return {
getEvents () {
return {
'node:mousedown': 'onMousedown',
mouseup: 'onMouseup',
mousemove: 'onMousemove'
};
},
onMouseup (ev: any) {
if (_this.addingEdge && _this.edge) {
if (ev.target.get('isInPoint')) {
const node = ev.item;
const targetId = node.getModel().id;
const sourceId = _this.edge._cfg.source._cfg.id;
if (sourceId === targetId) {
removeEdge();
return;
}
const result = _this.flowChartAddEdge(_this.edge, targetId, sourceId);
if (result) {
_this.edge = null;
_this.addingEdge = false;
} else {
removeEdge();
}
} else {
removeEdge();
}
}
},
onMousedown (ev: any) {
if (_this.flowIsRunning) {
Message.error('程序正在运行中');
return;
}
if (ev.target.get('isOutPoint')) {
if (!_this.addingEdge || !_this.edge) {
const point = { x: ev.x, y: ev.y };
const sourceId: string = ev.item._cfg.id;
_this.edge = _this.graph.addItem('edge', {
id: new Date().getTime(),
source: sourceId,
target: sourceId
});
_this.addingEdge = true;
}
}
},
onMousemove (ev: any) {
const point = { x: ev.x, y: ev.y };
if (_this.addingEdge && _this.edge) {
_this.graph.updateItem(_this.edge, {
target: point
});
}
}
};
});

4. 操作节点

使用find、findById、findAll寻找节点或边
使用updateItem、update更新节点或边
使用removeItem、remove删除节点或边
具体可看G6文档

5. 操作画布

画布缩放、自适应、流程图layout等可看G6文档,使用相应方法便可实现。

6. 自定义节点

使用G6.registerNode注册自定义的节点,再draw方法绘制,部分代码如下:
(需要注意的是自定义节点会有偏移,一定要计算好y轴位置,否则会影响选中等操作。自定义节点和边一定要在画布实例化之前注册)

1
2
3
4
5
6
7
8
9
10
11
12
13
14
15
16
17
18
19
20
21
22
23
24
25
26
27
28
29
30
31
32
33
34
35
36
37
38
39
40
41
42
43
44
45
46
47
48
49
50
51
52
53
54
55
56
57
58
59
60
61
62
63
64
65
66
67
68
69
70
71
72
73
74
75
76
77
78
79
80
81
82
83
84
85
86
87
88
draw (cfg: any, group: any) {
const keyShape = group.addShape('rect', {
attrs: {
id: cfg.id,
width: cfg.width,
height: cfg.height,
x: offsetX,
y: offsetY,
fill: '#29313f',
radius: 2,
cursor: 'move'
},
draggable: true,
name: 'key-shape'
});
if (cfg.logoIcon) {
group.addShape('image', {
attrs: {
width: 16,
height: 16,
x: iconX,
y: iconY,
img: cfg.logoIcon
},
draggable: true,
name: 'logo-icon'
});
}
if (cfg.label) {
group.addShape('text', {
attrs: {
x: labelX,
y: -11,
text: cfg.label,
fill: '#fff',
font: 'PingFangSC-Regular',
fontSize: 14
},
draggable: true,
name: 'text-shape'
});
}
const inputPoint = group.addShape('rect', {
attrs: {
x: -5,
y: -cfg.height - 5,
fill: '#447DCE',
width: 10,
height: 10,
opacity: 0,
lineWidth: 20,
stroke: 'transparent',
cursor: 'crosshair'
},
name: 'input-point'
});
inputPoint.set('isInPoint', true);
const outputPoint = group.addShape('rect', {
attrs: {
x: -5,
y: -5,
fill: '#447DCE',
width: 10,
height: 10,
stroke: '#fff',
lineWidth: 1,
radius: 5,
opacity: 1,
cursor: 'crosshair'
},
name: 'output-point'
});
outputPoint.set('isOutPoint', true);
if (cfg.stateIcon) {
group.addShape('image', {
attrs: {
width: 16,
height: 16,
x: iconX2,
y: iconY,
img: cfg.stateIcon
},
draggable: true,
name: 'state-icon'
});
}
return keyShape;
}

7. 运行时节点和边的动画效果

节点动画在注册自定义节点时,afterDraw里实现

1
2
3
4
5
6
7
8
9
10
11
12
13
14
15
16
17
18
19
20
afterDraw (cfg: any, group: any) {
if (cfg.animate) {
stateIcon.animate(
() => {
index = index + 0.5;
if (index > icons.length - 1) {
index = 0;
}
return {
img: icons[Math.floor(index)]
};
},
{
repeat: true, // 动画重复
duration: 3000,
easing: 'easeLinear'
}
);
}
}

在运行时边有虚线运动效果,需要提前注册自定义的边

1
2
3
4
5
6
7
8
9
10
11
12
13
14
15
16
17
18
19
20
21
22
23
24
25
26
27
28
G6.registerEdge(
'line-dash',
{
afterDraw (cfg: any, group: any) {
const shape = group.get('children')[0];
const length = shape.getTotalLength();
let totalArray: Array<any> = [];
for (let i = 0; i < length; i += interval) {
totalArray = totalArray.concat(lineDash);
}
let index = 0;
shape.animate(
() => {
const cfg = {
lineDash: dashArray[index].concat(totalArray)
};
index = (index + 1) % interval;
return cfg;
},
{
repeat: true,
duration: 3000
}
);
}
},
'polyline'
);

总结

G6库比较成熟,使用起来很顺手,需要多看API。